
Traditional APM vs Modern AI-Powered APM: A Full Comparison
Why this matters now
Plant and portfolio managers hear promises about “smarter” maintenance and better KPIs. The core question is practical: how does APM asset performance management look when it’s built around decades old workflows versus when it’s powered by modern AI? That’s what this post answers, clearly, with real examples and actionable guidance for owners, operators, and O&M leads in solar, wind and BESS.
In the next few minutes you’ll learn:
- What each approach actually does day-to-day.
- Where traditional APM still works and where it doesn’t.
- How AI changes decision speed, accuracy, and cost-to-fix.
- Practical steps to evaluate AI-powered APM for your assets.
Asset Performance Management: Definition and Evolution
What is asset performance management? At its simplest, asset performance management (APM) is the set of people, processes, and tools used to keep physical assets, turbines, inverters, and batteries operating reliably and efficiently. Traditional APM focuses on scheduled inspections, condition-based thresholds, and manual analysis of historical failure data. Modern APM layers analytics and AI on top of those foundations to help prioritize work, predict failures with more nuance, and surface the exact corrective steps operators need.
Why the distinction matters: Traditional APM optimizes around known failure modes and human workflows. AI-powered APM optimizes outcomes by continuously learning from heterogeneous data, sensor series, SCADA, manuals, fault codes, work orders, and even technician notes and recommending prioritized actions.
How traditional APM works: Strengths and limits
Core elements
- Scheduled inspections and preventive maintenance calendars.
- Condition monitoring dashboards with threshold alarms.
- Manual root-cause analysis after an incident.
- Spreadsheets and static reports to measure MTTR, availability, and cost.
Strengths
- Proven, auditable processes that fit regulated environments.
- Easier vendor interoperability for established tools.
- Clear service schedules for contractor planning.
Limits
- High false-alarm rates when thresholds are simplistic.
- Reactive bias because many fixes happen after performance has already degraded.
- Long analyst cycles to correlate diverse data sources.
- Hard to scale across hundreds of distributed assets without ballooning headcount.
How AI-Powered APM changes the game
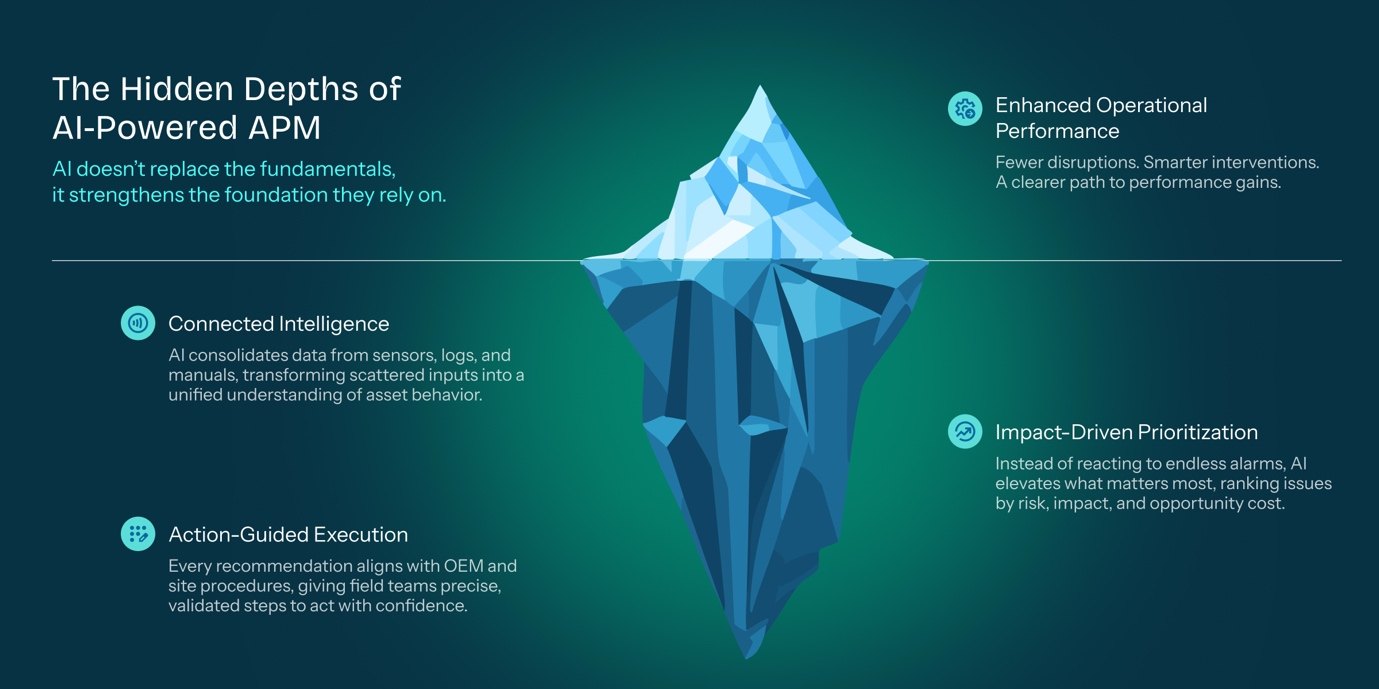
AI-powered APM doesn’t replace the fundamentals; it augments them. The measurable differences show up in three areas:
Data synthesis at scale
AI ingests and links sensor streams, maintenance logs, OEM manuals, and fault dictionaries. That means a single platform can surface likely root causes faster than manual correlation.
Prioritization over alerts
Instead of a long list of alarms, AI ranks issues by risk and expected impact on availability and revenue. Your crew gets a short, prioritized to-do list.
Actionable instructions
Advanced systems map recommended actions to OEM procedures and on-site SOPs so field teams get the exact steps not just a generic “replace part” message.
Operational benefits
- Lower mean time to repair (MTTR) through precise diagnosis.
- Reduced unnecessary maintenance (lower O&M spend).
- Faster ramp back to full output after faults.
- Better long-term planning based on predicted degradation curves.
Side-by-side comparison: What to measure
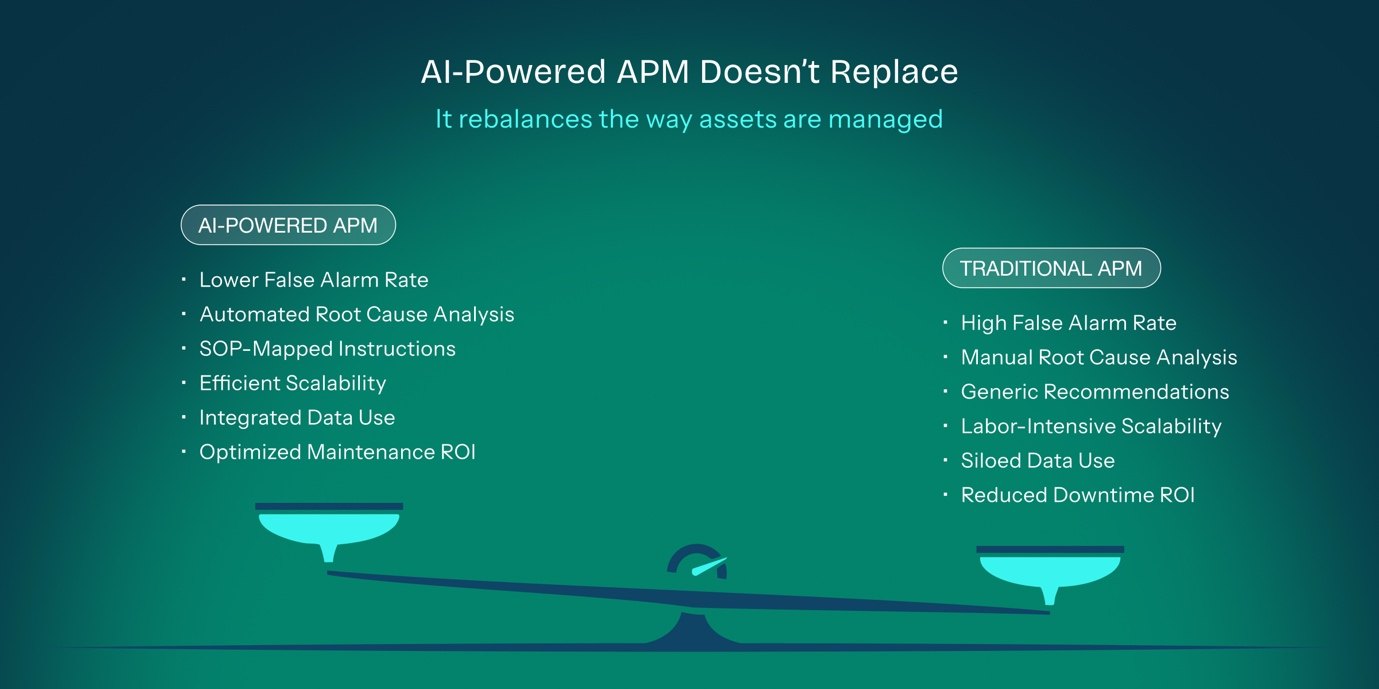
| Dimension | Traditional APM | AI-Powered APM |
|---|---|---|
| Detection approach | Threshold alarms, scheduled checks | Pattern recognition, anomaly detection, probabilistic risk |
| False alarm rate | Often high | Lower — models learn true failure signatures |
| Time to root cause | Hours – days (manual) | Minutes – hours (automated triage) |
| Actionability | Generic recommendations | Step-by-step, SOP-mapped instructions |
| Scalability | Labor-intensive | Scales across portfolios with less headcount increase |
| Data use | Siloed (SCADA / CMMS) | Integrated (documents, logs, sensor series) |
| Typical ROI levers | Reduced unplanned downtime | Reduced downtime + optimized maintenance spend |
Practical considerations for adoption (Solar, Wind, BESS)
If you’re evaluating an AI solution, focus on these practical checkpoints:
- Data readiness: Can the platform ingest your SCADA, CMMS, and documents (manuals, SOPs, fault codes)? AI works best when it can connect to the actual sources operators use.
- Explainability: Will the system show why it flagged an issue and the evidence behind a recommendation? Your ops team needs confidence in the suggestion.
- Action mapping: Does the platform map recommendations to OEM repair steps and your SOPs so technicians can execute without extra lookup?
- Integration with workflows: Can it create or populate work orders in your CMMS and track outcomes automatically?
- Pilot scope & metrics: Pilot on a defined subset (e.g., 20 turbines, or 1 MW of BESS) and measure MTTR, false alarm rate, and maintenance spend before scaling.
- Change management: Train dispatch and field personnel on how to interpret prioritized recommendations. AI augments decisions; it doesn’t remove operator judgment.
Implementation roadmap: a realistic 90-day pilot
This staged approach reduces risk and lets teams adapt workflows gradually.
FAQs
What is asset performance management?
It’s the holistic practice of monitoring, maintaining, and optimizing physical assets to maximize availability and minimize cost. (See definition earlier in the post.)
Will AI remove my field teams?
No. The best AI-powered APM reduces time spent on diagnostics and increases time technicians spend fixing higher-value issues.
How fast do I see value?
Pilots commonly show measurable improvements (fewer false alarms, faster diagnosis) within 3-6 months, depending on data quality and asset complexity.
Conclusion
Traditional APM gave us structure; AI-powered APM gives us scale and precision. For owners and O&M leaders who must cut costs while protecting uptime, the practical path is a measured pilot that proves data readiness, explainability, and operational fit.
Ready to see how AI could prioritize your next dispatch and lower O&M spend?
See connected, AI-powered asset performance management in action across solar, wind, and BESS.