

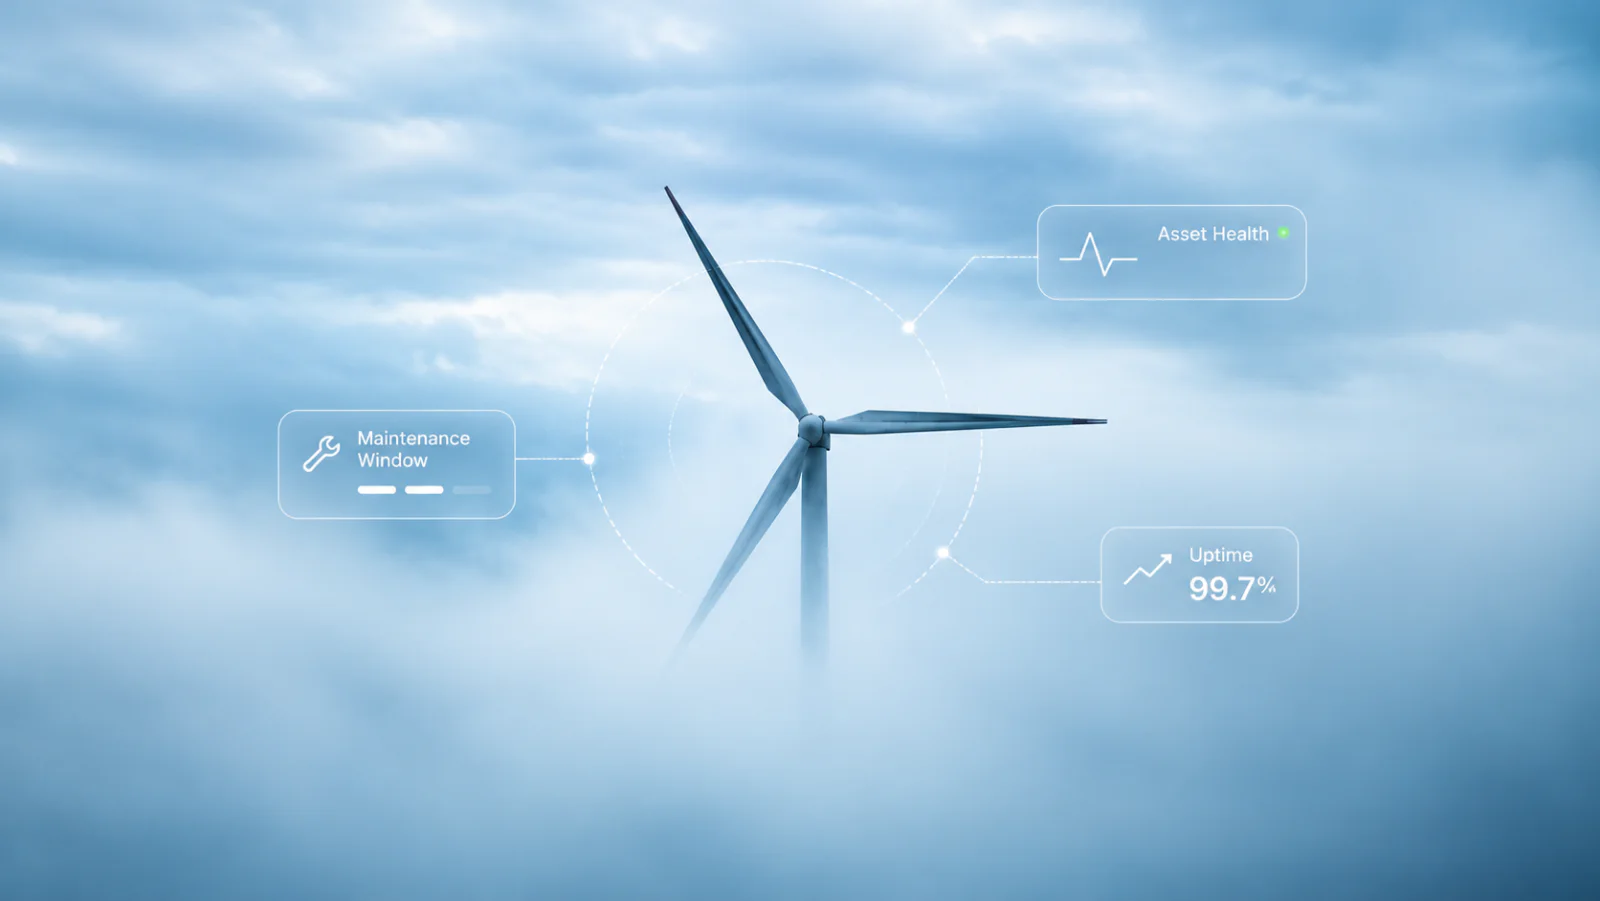
Asset performance management (APM) software turns SCADA, sensor and work-order data into prioritized actions. For wind and solar operators, ten use cases are where it pays back: predictive maintenance, benchmarking, power curve analysis, automated work orders, condition-based dispatch, downtime root-cause analysis, spare parts planning, production forecasting, compliance reporting and performance validation. Start with predictive maintenance and downtime tracking.
Why APM matters for wind and solar operators
Wind and solar now make up most of the world’s renewable fleet. IRENA counted 5,149 GW of renewable capacity at the end of 2025, of which solar was 2,391 GW and wind 1,291 GW. Operators of those assets manage turbines, inverters and storage units that generate millions of data points a day. The challenge is not collecting that data. It is turning it into decisions that improve uptime, output and return.
Teams that rely on manual analysis tend to stay in reactive troubleshooting and miss early signals. APM helps operators:
- Detect issues early, before they escalate into failures.
- Dispatch crews only when needed, reducing truck rolls.
- Optimize spare parts and labor.
- Automate compliance and reporting workflows.
- Improve production forecasts and market participation.
The top 10 APM use cases for wind and solar
1. Predictive maintenance and failure prevention
APM software combines sensor data, SCADA streams and AI analytics to flag developing faults, from gearbox bearing wear in wind turbines to DC string faults in solar arrays, early enough to plan the repair. A bearing caught early can be replaced in a low-wind window instead of after an unplanned stop.
2. Performance benchmarking across assets
Compare turbines, inverters or whole plants against expected baselines. Benchmarking exposes chronic underperformance, shows where to focus O&M effort and creates a feedback loop for continuous improvement.
3. Power curve and efficiency analysis
Compare each turbine’s power curve and each inverter’s efficiency with OEM specifications. In wind this surfaces yaw misalignment, pitch errors and blade degradation. In solar it surfaces soiling, string-level faults and inverter derating. Re-run the analysis after a fix to confirm the gain.
4. Automated work order creation
Platforms such as GreenBridge.AI integrate with CMMS and ERP systems to generate work orders automatically when anomalies are detected. That cuts administrative overhead and speeds up response.
5. Condition-based dispatch
Move from calendar-based maintenance to dispatch driven by asset condition. Crews go out when the data says action is needed, which lowers O&M cost and reduces safety exposure.
6. Downtime tracking and root-cause analysis
Go beyond basic downtime logging. APM categorizes downtime by cause (grid, mechanical, weather), shows trends and lets O&M teams remove systemic issues rather than treat symptoms.
7. Spare parts and inventory optimization
Predict spare parts demand from wear patterns and failure rates, so inventory stays at the right level and lead times shrink.
8. Production forecasting and scenario planning
Use historical and real-time data to forecast generation and test what-if scenarios. Better forecasts support energy market bidding and revenue optimization.
9. Compliance and reporting automation
Produce investor, regulatory and ESG reports from the same trusted operational data, with less manual compilation, fewer errors and an audit trail. Our Compliance Intelligence module is built for exactly this.
10. Performance testing and validation
Verify that corrective actions, retrofits and software updates deliver the production gain you expected. This closes the loop between an intervention and its measurable impact.
Quick reference: data and KPI for each use case
| Use case | Data needed | KPI to track |
|---|---|---|
| 1. Predictive maintenance | SCADA, condition and vibration data, fault history | Unplanned downtime hours; MTBF |
| 2. Benchmarking | Production and availability by asset, expected baselines | Performance gap vs. baseline (capacity factor or performance ratio) |
| 3. Power curve and efficiency | SCADA data, OEM curves, meteorological data | Energy lost vs. expected output |
| 4. Automated work orders | Alarm data, CMMS or ERP integration | Time from alarm to work order |
| 5. Condition-based dispatch | Condition indicators, crew schedules | Truck rolls per MW; planned vs. reactive work |
| 6. Downtime and root cause | Event logs, cause codes | Availability; downtime by cause |
| 7. Spare parts | Failure rates, wear trends, supplier lead times | Stock-outs; inventory holding cost |
| 8. Forecasting | Historical generation, weather data | Forecast error; imbalance cost |
| 9. Compliance reporting | Performance, maintenance and compliance records | Hours to produce reports; audit findings |
| 10. Performance validation | Production data before and after an intervention | Measured uplift vs. expected |
How to get started with APM
- Audit your data sources. Map existing SCADA, DAS and CMMS systems to see where operational data lives and how it flows.
- Prioritize high-impact use cases. Begin with predictive maintenance or downtime tracking to show measurable ROI quickly.
- Integrate with O&M workflows. Connect APM insights to your CMMS or dispatch system so alerts create work orders, notify crews or adjust maintenance schedules.
- Track impact. Monitor availability, MTBF and production uplift to demonstrate value and decide what to add next.
GreenBridge.AI’s APM solution includes a use case prioritization framework to help operators focus on the highest-value opportunities first. For a view of how APM differs from traditional tools, read Traditional APM vs AI-Powered APM.
From dashboards to decisions
The value of APM is not the dashboard or the alert. It is how teams work day to day. Once the right data streams are connected and workflows are automated, operators shift from firefighting to performance-led decisions: fewer emergency callouts, faster root-cause resolution and measurable gains in availability and output. The most advanced operators use APM as the base for integrated operations, where insights guide maintenance, resource allocation and energy market strategy in one continuous loop.
Frequently asked questions: APM in wind and solar
- What is APM in renewable energy?
- Asset performance management (APM) is a data-driven practice that uses software, analytics and automation to monitor, optimize and improve the performance of wind and solar assets.
- How does APM improve ROI for wind and solar operators?
- By reducing unplanned downtime, optimizing maintenance schedules and recovering lost output. For scale, the U.S. Department of Energy’s O&M guide estimates predictive maintenance can save 8–12% over a preventive program. Actual results depend on your baseline and data quality, so measure availability, MTBF and production uplift in a pilot.
- Is APM software different from SCADA or CMMS?
- Yes. SCADA collects operational data and CMMS manages work orders. APM is the intelligence layer that analyzes that data, prioritizes actions and links SCADA and CMMS workflows.
- What is the best starting point for implementing APM?
- Predictive maintenance and downtime tracking. They deliver fast ROI and lay the foundation for later use cases such as inventory optimization and automated reporting.
- Does APM work for hybrid portfolios (solar, wind and BESS)?
- Yes. Modern platforms such as GreenBridge.AI are portfolio-agnostic and manage solar, wind and storage assets under a single performance layer.
Conclusion
The future of wind and solar operations will not belong to whoever collects the most data, but to whoever turns data into decisions fastest. These ten use cases show where APM does that: it links engineering insight, operational action and business impact, and moves teams from reactive maintenance to continuous performance improvement. GreenBridge.AI was built for that shift, so every alert, dispatch and intervention is guided by context.
Want to see which use cases would pay back first on your portfolio? Tell us about your assets.
Sources
- IRENA, Renewable Capacity Statistics 2026 (April 2026): global renewable capacity 5,149 GW, solar 2,391 GW, wind 1,291 GW at end-2025. Coverage: pv-tech.
- U.S. Department of Energy, Federal Energy Management Program, Operations & Maintenance Best Practices Guide, Release 3.0 (2010): predictive maintenance programs can save 8–12% over preventive programs. energy.gov/femp.